
Practical technical support
Why a fast connection can still lag
Understand throughput, latency, jitter and packet loss, then investigate uneven timing with carefully labelled Wi-Fi and Ethernet comparisons.
Last reviewed:
A large download number is only one part of performance
Throughput describes how much useful data transfers in a period, often in megabits per second. Latency describes delay. A large file can transfer quickly once underway while a short interactive exchange still feels slow.
Consider an illustrative 500 Mbps connection that occasionally pauses for half a second, beside a 100 Mbps connection with steadier timing. The first may finish a download sooner while the second feels better for conversation. Those are invented examples, not recommended thresholds.
A work VPN, game server, video-call relay and nearby speed-test endpoint are also different destinations. Good performance to one does not prove that all will behave identically.
Know what the measurement actually captures
| Measurement | Useful meaning | Important limit |
|---|---|---|
| Throughput | Useful transfer rate on the tested path. | Not the capacity of every local link or application. |
| Round-trip latency | Delay for a particular exchange and return. | Not a measured one-way delay. |
| Jitter | Variation in delays under a stated calculation. | Different tools can calculate it differently. |
| Packet loss | Packets that fail to arrive under a defined test method. | Does not identify the cause or location alone. |
| HTTP response time | Timing of a browser web request. | Not a raw ICMP ping or direct packet-loss count. |
Check the method as well as the unit. Browser requests may reuse a connection or require setup. A ping command normally uses ICMP, which a network may restrict independently of ordinary browsing. Two values in milliseconds need not measure the same exchange.
Why variation disrupts calls
A conversation needs small audio chunks to arrive regularly. The app can buffer some variation, but buffering adds delay. Very late or missing data may cause clipped speech, frozen video or reduced quality even when there is substantial transfer capacity.
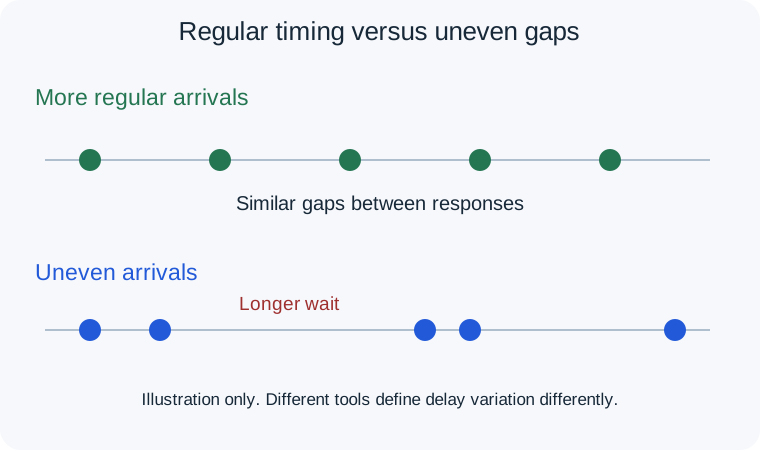
The diagram uses invented timings to illustrate a pattern, not real measurements. The upper row is regular; the lower has uneven gaps. One average can hide this difference.
Causes can include wireless contention, queued uploads, a busy router, provider congestion, a VPN route or the destination. Device load affects browser measurements too. One spike does not identify a faulty router or prove a provider outage.
Record a quiet baseline
Pause transfers on devices you control. Keep the device, browser, location and test destination consistent, then run the stability monitor with the tab visible and device awake. Note the time and connection type.
If problems usually occur during uploads, compare a separately labelled run while that ordinary activity resumes. Queues can add delay when capacity is busy. This may justify investigating traffic management, but does not establish that a particular “gaming” router feature will help.
Running a full speed test simultaneously deliberately loads the connection. That can be informative, but it is not an idle baseline. Label the conditions rather than combining both kinds of result into one score.
Compare wireless and wired paths
- Test where the problem occurs, recording Wi-Fi and other activity.
- Repeat nearer the access point without unnecessarily changing the app or VPN.
- If possible, use Ethernet on the same device and disconnect Wi-Fi for that run.
- Repeat around the usual failure time and retain the reports, including ordinary runs.
A steadier wired result suggests investigating the wireless path or associated policy. It does not automatically justify replacing equipment. Similar patterns on both connections make shared components worth examining. If only one app fails, its service status and own call statistics may be more relevant.
Interpret the WAIU monitor honestly
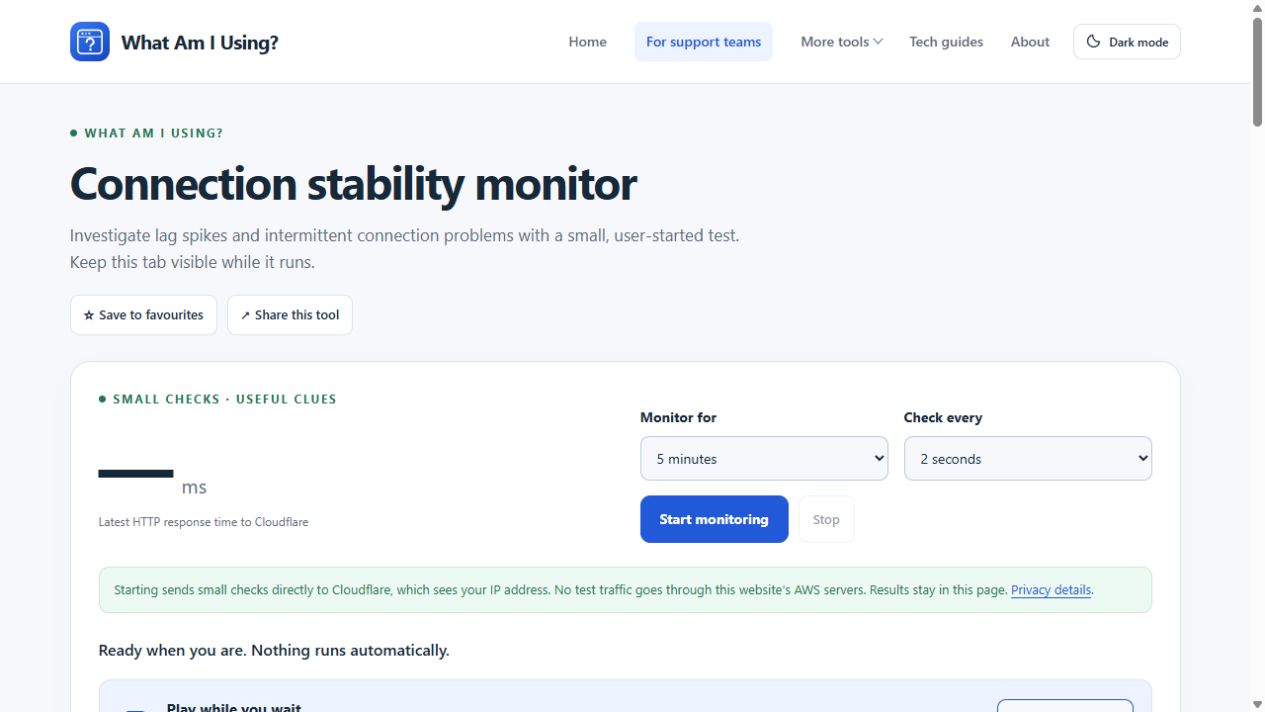
WAIU’s monitor uses small HTTP requests to Cloudflare. Its jitter value is the average absolute difference between consecutive successful response times; a missed check breaks the sequence. A red cross means that request did not complete successfully.
Do not call three missed checks out of a hundred “3% internet packet loss”. A blocked endpoint, browser restriction, service problem or connection failure can all affect requests. The page stops when hidden because browsers can throttle background work. A completed test describes that period, not a guarantee for the whole day.
Give support a testable question
A fictional report might say: “The call froze twice at 18:40. A separate office Wi-Fi run showed uneven timings. Ethernet on the same laptop was steadier. Cloud backup was paused.” That reports evidence without claiming a confirmed cause.
Attach the relevant report, describe the application symptom and ask which comparison would help next. Keep throughput, HTTP timing and call statistics separate so an engineer can relate them to the actual path.